Your break-even point, calculated live
Three numbers are all it takes: your selling price, what each sale costs you, and your fixed costs. The calculator does the rest, in plain English, not accounting jargon.
Updated July 2026.
Your three numbers
Pre-filled with an example: replace each value with your own.
Your break-even point
- Contribution margin price − variable cost
- - -
- Break-even in units units to sell each month
- -
- Break-even in revenue minimum monthly revenue
- -
Enter your three values to run the calculation.
Indicative calculation, excluding VAT and seasonality. Break-even in units is rounded up: nobody sells three quarters of a baguette.
The break-even point, explained straight
What is it, exactly?
Your break-even point is the level of activity at which your business stops losing money. Every sale generates a margin: the price, minus what that sale directly costs you. As long as those margins add up to less than your fixed costs, every month digs the hole a little deeper. Beyond that point, every extra sale is profit.
The formula fits on a till receipt: fixed costs divided by the margin per unit. That is exactly what the calculator above does.
Why does it matter so much?
Because it is the first number your banker will look for in your business plan, and the first one you should know by heart. It turns a hunch (“it should work out”) into a concrete target: that many sales a month, not one fewer.
Nearly 1 in 3 French companies founded in 2018 were gone before their fifth birthday, proof that a business plan doesn't run itself (Source: Insee, 2025). Knowing your break-even point, and recalculating it whenever reality moves, is where that steering starts.

The 3 mistakes that skew your break-even point
The maths is simple. It's the numbers you feed it that lie.
Forgetting variable costs
The purchase price, sure. But also the platform's commission, packaging, delivery, the card fees on every payment. Every euro you forget inflates your margin on paper, and lowers a break-even point you will never actually reach.
Treating fixed costs as frozen
“Fixed” doesn't mean “forever”. A new hire, a bigger office, one more software subscription: fixed costs climb in steps. A break-even point calculated once in January starts lying at the first recruitment.
Confusing profitability with cash
You can sell above break-even and still end the month overdrawn: it only takes customers paying late while your suppliers collect upfront. Break-even says “profitable”: it doesn't say “solvent”.
A ballpark figure is good. A forecast is better.
Let's be honest: this calculator gives you a snapshot, built on averages. Your business is a moving picture, and it rarely moves in a straight line.
-
Seasonality
Your “average” break-even point says nothing about a dead summer or a December that makes a third of the year. In BeretPlan, every line can flex month by month.
-
Payment lags
Sell in March, collect in May: the P&L is happy, the bank account less so. A real forecast puts those lags down in black and white.
-
Hires and step changes
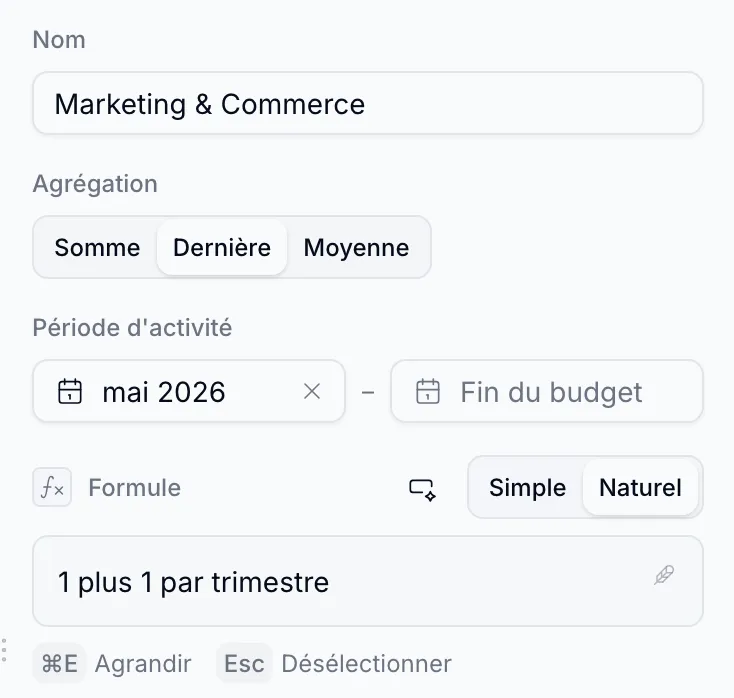
Every recruitment moves your break-even point. With per-line activity periods, a salary that starts in September starts in September, and the plan recalculates.
That is exactly what BeretPlan does: your assumptions become named variables, your forecast a living model, and your break-even point recalculates with every change, without breaking a single formula.

Go from break-even point to full plan.
Set your assumptions as variables and get a forecast your banker can challenge, and you can defend.
Free, no credit card required